
The UK Housing Squeeze
The UK housing crisis is often discussed in emotional terms. But structurally, it is about one thing: how housing costs have evolved relative to income. By examining property prices, rents, wages, and now mortgage rates from 2010 to today, we can see whether the crisis is cyclical or deeply structural.
This analysis uses indexed data (2010 = 100), affordability ratios, and borrowing costs to examine what has really changed.
Trends in Property, Rental, and Wage Indices Since 2010
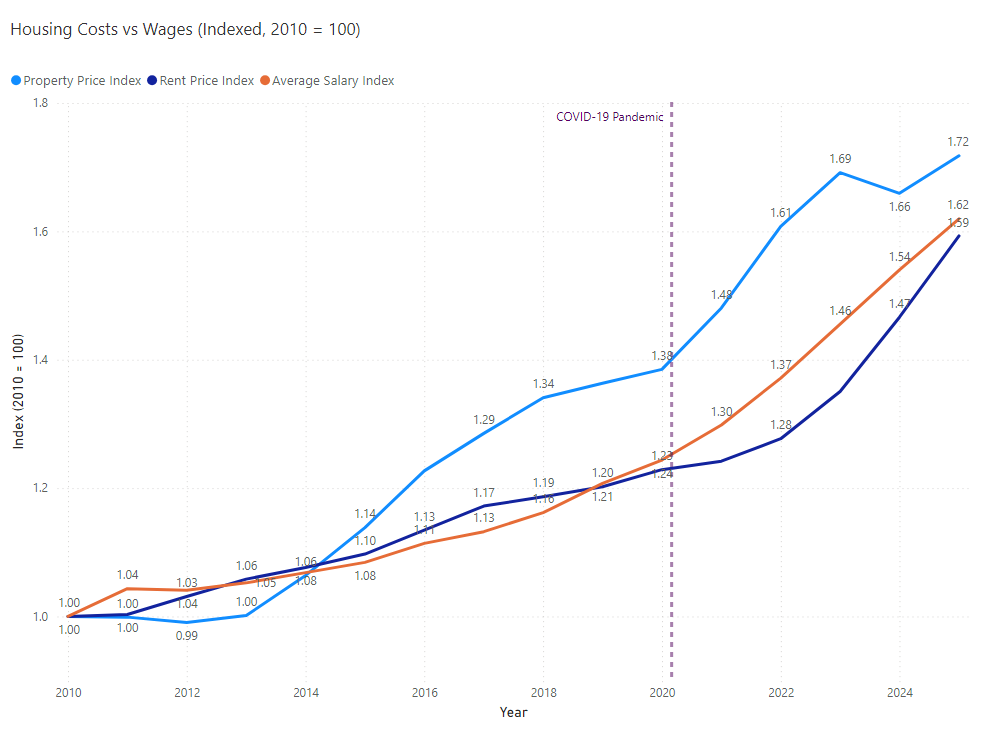
Property prices rose from an index value of 100 to 172, which is a 72 percent increase.
Rental prices reached approximately 159, indicating a 59 percent increase.
Wages also increased to around 162, which means a 62 percent rise.
Wage growth initially followed rental price increases, the gap is closing, and in recent years, rental prices have increased faster; meanwhile, property prices have consistently outpaced income since 2014.
A significant structural break is evident after 2020. Property prices accelerated sharply, whereas wage growth remained comparatively gradual. This divergence is reflected in the pronounced post-pandemic increase in the property price index.
This trend does not represent a single-year anomaly; rather, it reflects a cumulative divergence over an extended period.
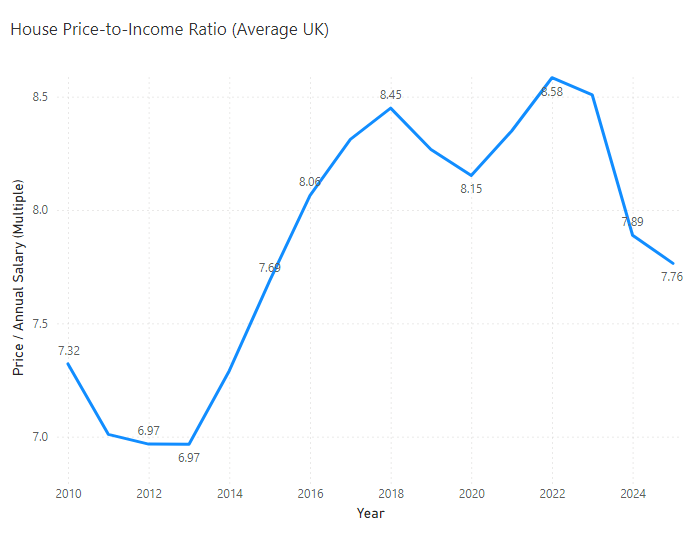
This chart highlights the most common way of examining home ownership affordability: the number of years of income needed to buy an average home.
In 2010, the ratio was about 7,3 times the annual income.
By 2022, it reached a peak of nearly 8,6 times the income.
This increase might seem small at first, but when applied to homes valued at hundreds of thousands of pounds, the difference is significant.
Even with a slight drop in 2024 and 2025, the ratio is still much higher than it was in the early 2010s.
The main point is that owning a home has become much harder over time, even before considering financing costs.
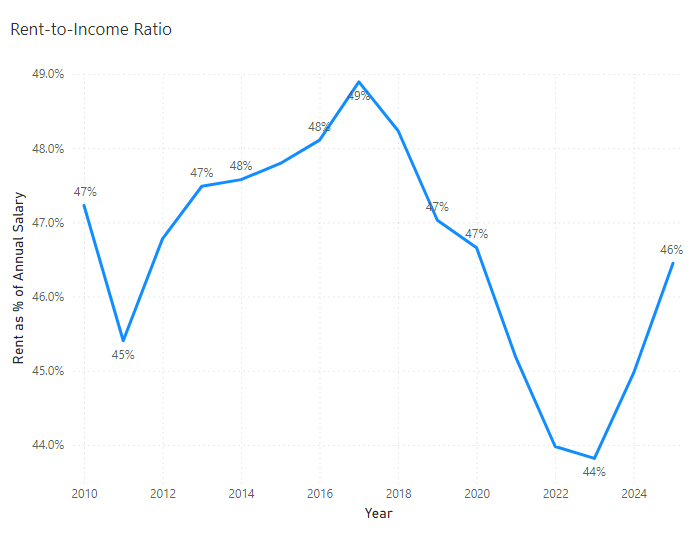
Rent has consumed between 45% and 49% of annual income for most, between 2010 and 2025.
The ratio peaked near 49% in 2017, dipped during the pandemic, and has since rebounded to 46% in 2025.
Unlike ownership, rent did not experience a dramatic structural break, but it never provided meaningful relief either.
Renting has not served as a stabiliser for affordability; it has maintained consistently high pressure.
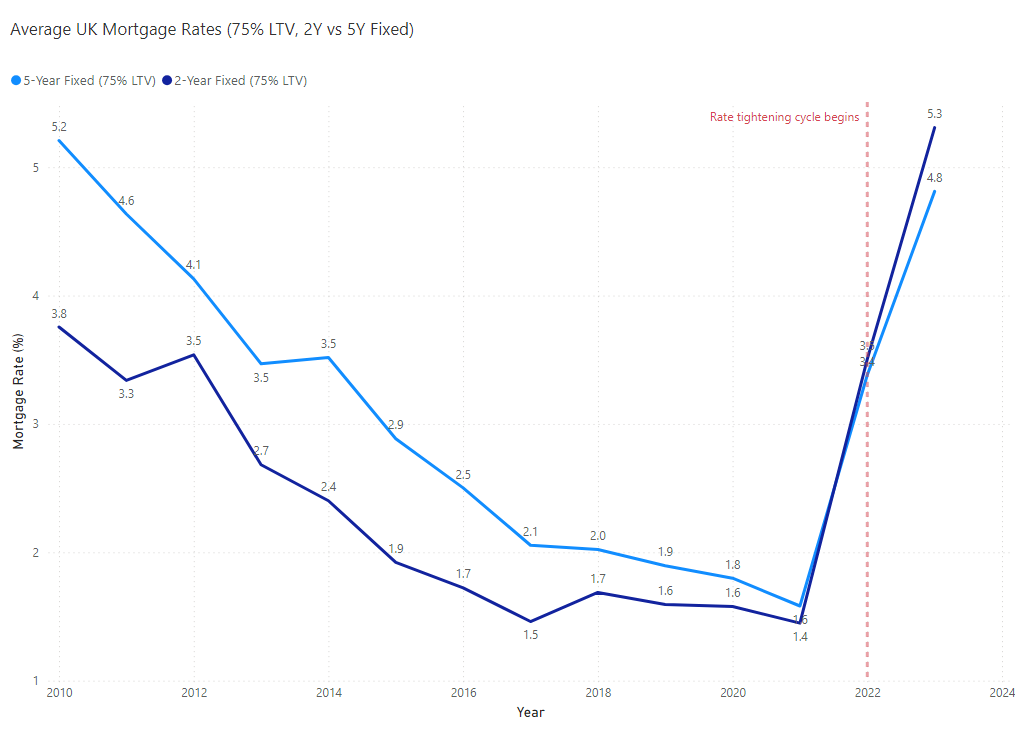
Mortgage rates play a key role in how people finance their homes.
Between 2010 and 2021, mortgage rates steadily went down:
2-year fixed mortgages fell from 3.8% to 1.4%
5-year fixed mortgages fell from 5.2% to 1.6%
This drop in rates helped make rising house prices a bit more affordable. While price-to-income ratios went up, the cost of borrowing was going down.
But starting in 2022, things changed.
Mortgage rates surged:
2-year fixed rates exceeded 5%
5-year fixed rates approached 5%
This led to a new situation where both home prices and borrowing costs were high. For the first time in more than ten years, families are dealing with both high home prices and high mortgage rates at the same time.
Why This Feels Different
The analysis discovered three structural phases:
2010–2019:
House prices started to move apart gradually, but lower mortgage rates helped ease the impact.
2020–2021:
House prices rose quickly when mortgage rates were extremely low.
2022–present:
A sudden jump in mortgage rates came on top of already high home prices.
This third phase is what drives the current stress in the housing market.
Although the price-to-income ratio has dropped somewhat, people now spend more of their income on financing than they did earlier.
Not just a short-term issue
The current housing shortage in the UK is not only due to recent interest rate hikes.
Instead, several factors have contributed to the problem:
House prices have grown faster than incomes for many years
Rents have remained high, putting pressure on households
Very low interest rates have pushed up asset prices
Rapid increases in interest rates
Today’s affordability problems are the result of high prices built up over the past decade, now combined with higher borrowing costs.
Unless wages rise significantly or more homes are built, this structural imbalance is unlikely to fix itself.
Data Sources:
Office for National Statistics (UK House Price Index, Average Earnings, Private Rental Market Statistics); Bank of England (Quoted Household Mortgage Rates, 75% LTV 2-year and 5-year fixed)